Soil data
questions
This page shows the collective results of all the soil analysis to look for trends across all of the eight sites. Data for individual plots can be viewed on the dedicated pages for Bedford Rd, Gray St, Heathryfold, Holburn St, Nellfield 2, Slopefield, Powis Edible Garden and Springhill Community Garden. Samples were collected from depths of 2-9 cm (main root zone), 15-22 cm (deep root zone) and 30+ cm (below root zone). Lots of information can be derived from the data, but we focussed on a few key questions:
- Is there a statistically significant difference in the a) organic matter content, b) nutrient content, and c) compaction of soils between dig, no-dig and uncultivated plot types? (i.e. Is there a difference which is not due to chance?)
- Are there signs of nutrient leaching to depths below the root zone? For this we compared cultivated and non-cultivated soils below 30 cm depth?
- Is there a tendency for any particular nutrient to be deficient?
organic matter
The mean percentage organic matter content by mass for the 2-9 cm root zone of dig, no dig and uncultivated plots are 10.01%, 23.89% and 13.17% respectively. However, these figures are skewed by unusually high values at Springhill Community Garden. This was due to the site having new no-dig, raised beds full of fresh compost. The organic matter content of these beds was up to 88.52% in the 2-9 cm layer. It can therefore be more meaningful to look at median (mid) values for each category. Median values are 9.89%, 14.03% and 13.13% respectively.

Figure 1 shows that no-dig beds tend to hold more organic matter than the dig plots in the upper soil layer. This is even after the top 2 cm of soil was discarded to eliminate areas of high variability.
We used the Kruskal-Wallis test to check if the difference between organic matter content in the different layers of soil between dig, no-dig and uncultivated soil. There was a significant difference in the 2-9 cm root zone (p = 0.01), but not at 15-22 cm (p=0.70) or 30+ cm (p=0.78).
Scotland’s Rural College (SRUC) recommend an organic matter content of over 5% in Scottish agricultural soils.
organic carbon
Soil organic carbon can be approximately calculated by dividing the soil organic matter content by 1.72. This is based on the common assumption that organic carbon makes up 58% of organic matter. If it is assumed that the organic matter content of the top 10 cm of soil is uniform based on the 2-9 cm measurements, the quantity of organic carbon in the top soil can be calculated in kilograms per metre square (kg OC/m2) or can be scaled up to tonnes per hectare (t OC/ha) to be more comparable to farm land.
This calculation considers the bulk density of the soil which narrows the range compared to percentage organic matter, as highly organic soil generally have a lower bulk density. ANOVA was applied to the organic carbon content of the three land types (dig, no-dig, uncultivated), finding a significant difference between the groups (p = 0.001).
The figures upscaled to t OC/ha are 35.31, 44.48, and 44.05 for dig, no-dig and uncultivated respectively.

nitrogen
Nitrate and ammonium, the forms of nitrogen which are readily available to plants are highly variable. Plants rapidly take up the nutrients and they move through the nitrogen cycle quickly. Many soil tests do not give nitrogen readings for this reason. While low figures may make it tempting to add more fertiliser, plant condition is a better indicator. Nitrate leaches easily from soil with rainfall and becomes an environmental pollutant in fresh water. Excessive use of nitrogen based fertilisers should be avoided for that reason.
There is a highly significant difference in nitrate levels between plot types at all depths. Figure 3 below shows that there are signs of nitrate leaching in soil below 30 cm depth when comparing cultivated and uncultivated areas. There was however, no significant difference in ammonium levels at any depth between the ground types.


potassium
A Kruskal-Wallis tests found that levels of potassium (K) in the soils were not significantly different between dig, no-dig and uncultivated areas at any depth when all 3 ground types were considered. The highest levels were found in the surface layer of dig beds. However, the median K concentration in no-dig beds remained reasonably consistent through the deeper soil and was higher than dig or uncultivated areas at 15-22 cm and 30+ cm.
Of the 199 samples, 73 were considered “very low” or “low”, while 79 were considered “moderate-” or “moderate+”. A total of 47 were considered “high” or “very high”.

phosphorus
There was a significant difference in phosphorus levels between ground type in the 2-9 cm soil layer (p=0.03). This was largely due to the difference between the cultivated and uncultivated areas. If the uncultivated are excluded, there is no significant difference between dig and no-dig plots (p=0.68). The significance of the mid-depth group was borderline with a p-value of 0.07.
From a total of 199 separate samples, 177 were considered to have “very high” levels, with a further 15 in the “high” category according to the descriptive SAC nutrient index.

calcium
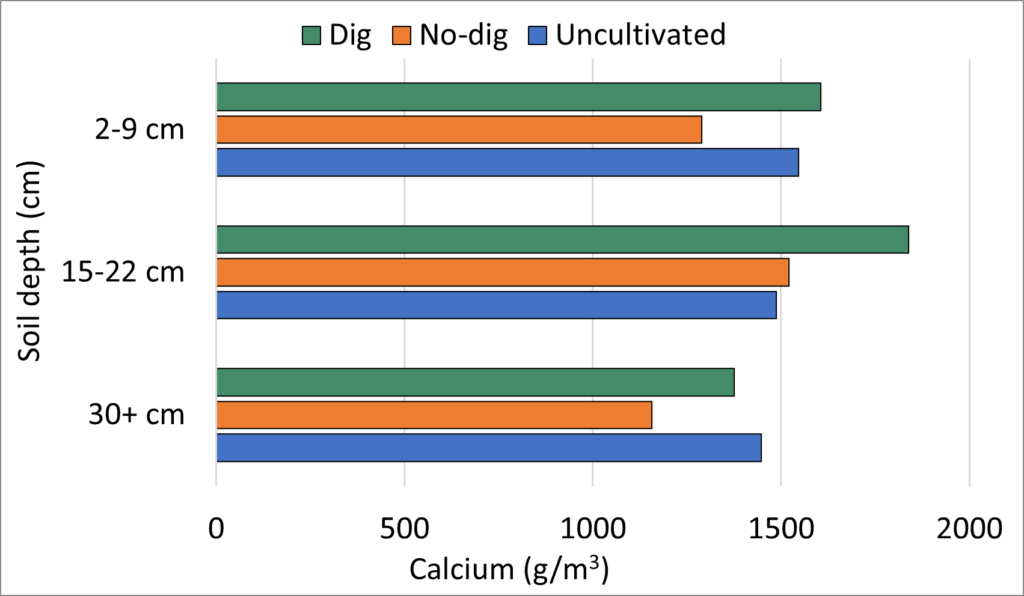
Calcium levels were not significantly different between dig, no-dig and uncultivated land at any depth. P-values generated by Kruskal-Wallis tests in for 2-9 cm, 15-22 cm and 30+ cm were 0.54, 0.10 and 0.77 respectively.
Calcium levels are related to the pH of the soil, with lower levels associated with lower pH. Excessive quantities can prevent other positively charged nutrients from binding to the soil.
magnesium
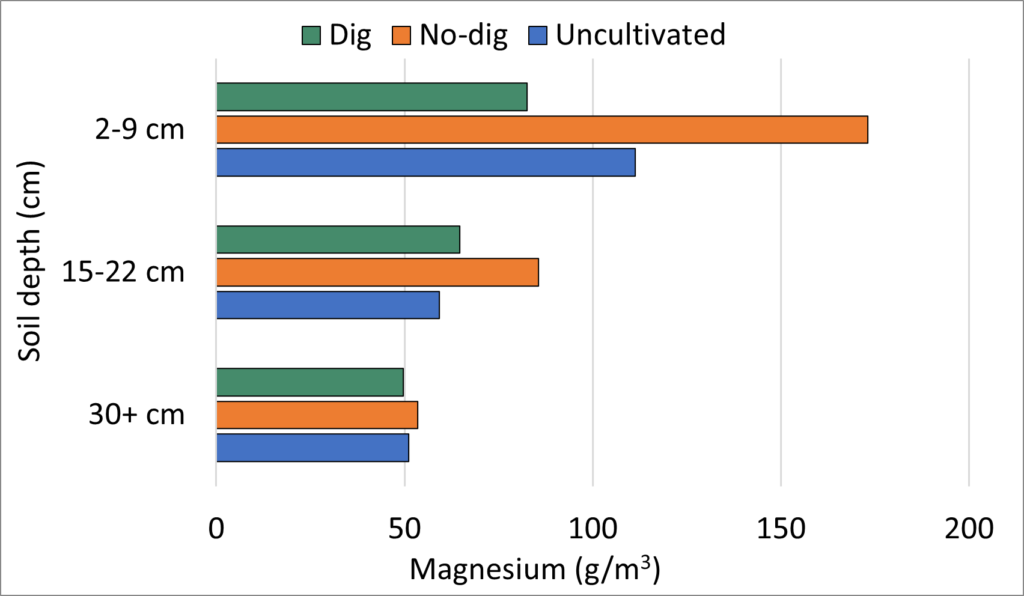
Soil magnesium levels were generally higher in no-dig soils. The difference was not statistically significant between ground types at depths of 15-22 cm or 30+cm. At 2-9 cm the significance was borderline (p=0.06).
82 of 199 samples were considered to be “very low” or “low” in magnesium, with 96 in the “moderate” category. No samples were considered to be “very high”.
interpretation

The nutrient values can be compared against indices produced by bodies such as SAC. The Potash Development Association provides a translation of the index. This gives an idea about whether there are sufficient nutrients for optimal growth of crops. However, it should be noted that these guidance values can depend on crop type and soil type, and may not fit in with what a particular grower wants to achieve. The figures also depend on the extraction methods used. Figures from the the cold acetic acid extraction method used in the university analytic laboratory are comparable with the Modified Morgans extraction method used by SAC, but not to methods used by DEFRA.
correlations between soil properties
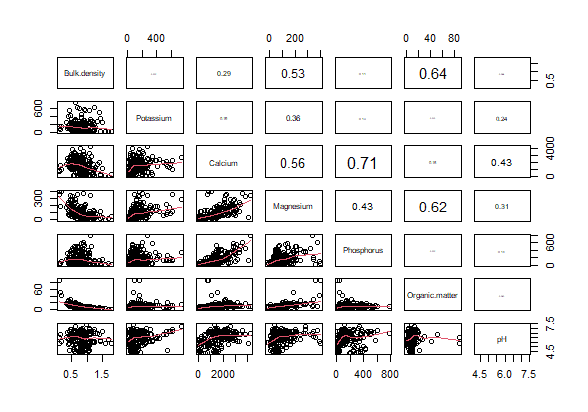
The maximum possible correlation value is 1.0, which would indicate 100% alignment between two variables. Figure 9 below shows that our highest correlation value was 0.71, which was between calcium and phosphorus levels. The second highest correlation was between bulk density and organic matter content. As organic matter generally has a low density, a high correlation value is expected.
soil compaction
Soil compaction was measured with a penetrometer with approximately 12 measurements at each site on each different ground type. Figure 11 shows the mean value for each depths for all the sites combined. It can be seen that uncultivated ground is more compact at all depths than cultivated ground, as may be expected. Values greater than 2000 kPa are highly restrictive to root growth. These mostly occurred in uncultivated ground with none in the main 2-9 cm root zone of cultivated areas.

Links to free literature
Soil-derived Nature’s Contributions to People and their contribution to the UN Sustainable Development Goals – Smith et al. (2021) – This international study led by an Aberdeen researcher links soils to all 17 Sustainable Development Goals (SDGs).
The contribution of small-scale food production in urban areas to the sustainable development goals: a review and case study – Nicholls et al. (2020) – This paper explicitly shows the contribution allotments and community gardens can make towards sustainable food production and the wider SDGs.
This study was funded and supported by EASTBIO Doctoral Partnership (by BBSRC), the University of Aberdeen and the University of Edinburgh

Disclaimer: The funders have no responsibility for the information provided or views expressed in this website. The views expressed are solely those of the author.